This function allows us to plot matrices easily
plot_matrix(x, ...)

# S3 method for matrix
plot(x, ...)
Arguments
| x | a matrix |
|---|---|
| ... | for S3 generic API consistency; does nothing |
Value
a ggplot object
Examples
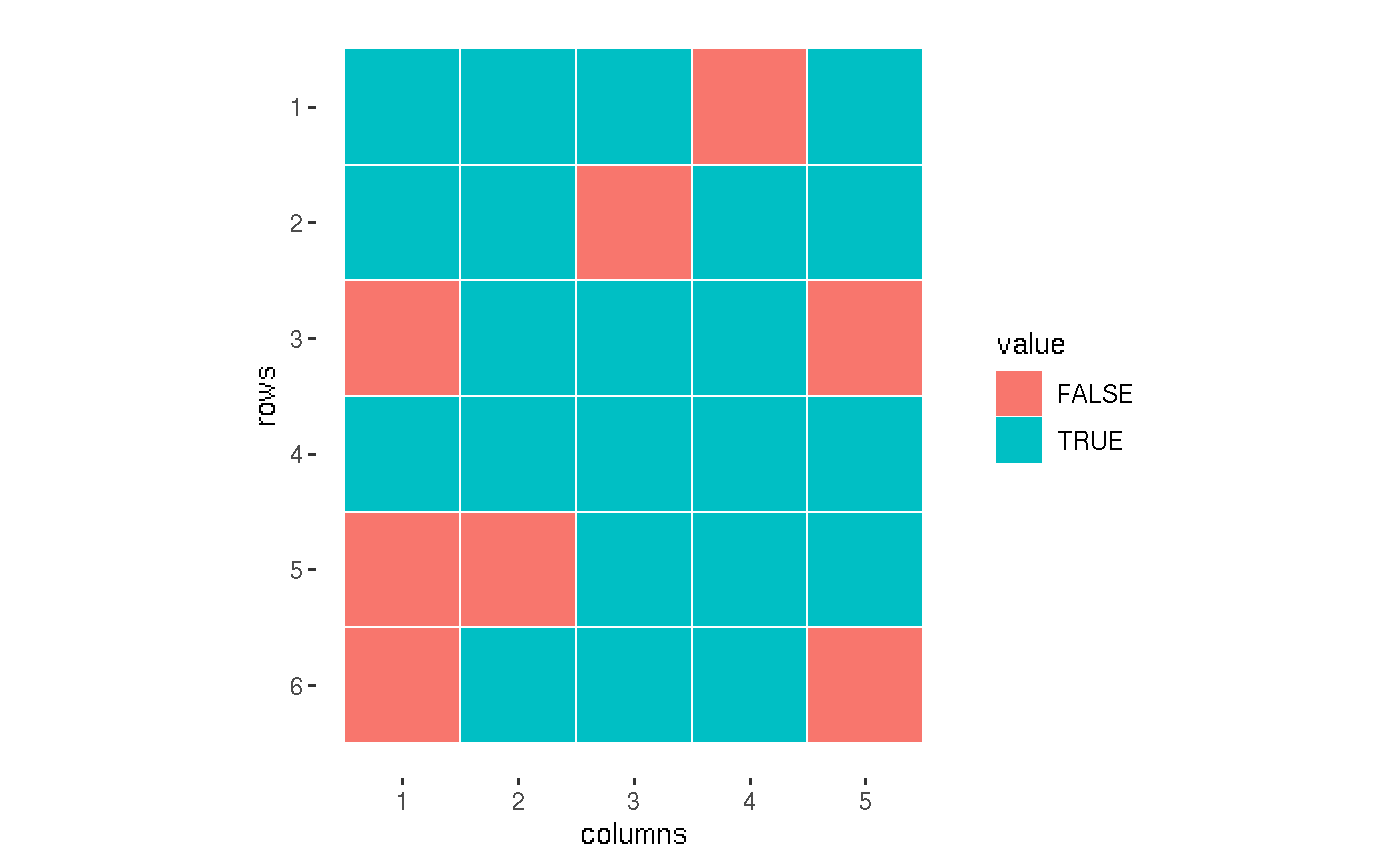
T <- TRUE; F <- FALSE x1 <- m(T, T, T, F, T | T, T, F, T, T | F, T, T, T, F | T, T, T, T, T | F, F, T, T, T | F, T, T, T, F) plot_matrix(x1)


